
Before starting a wireless survey it’s important to compare the receive sensitivity of the wireless client with the survey adapter. Typically survey adapters have a better receive sensitivity and therefore will record RSSI at higher levels than a client device may. We don’t want to design a wireless network based on the readings from a survey adapter only to find out the laptops have a weaker receive sensitivity and coverage is below the design thresholds.
In order to perform this calibration we need to collect RSSI readings from the wireless device so we can compare them with the readings taken from the survey adapter. This post includes information for collecting these readings and adjusting Ekahau based on them. This post will not be exhaustive from a device perspective, and each device presents unique challenges extracting RSSI readings. In this post I will focus on Windows, iOS, and OS X.
Calibration Location
Before starting the calibration process I suggest moving to a location close to the RSSI threshold selected for the RF design. This is typically somewhere between -67 and -65 dBm but will vary based on a large number of factors. Try to position the device we are calibrating for and the survey adapter as close to one another as possible for similar readings. It’s a good idea to collect readings from the RSSI cutoff at a few different locations throughout the facility. Whether a pre-deployment survey or post-deployment validation, move around to a few locations with different environmental conditions. Once you’ve selected your locations it’s time to collect readings.
Microsoft Windows
In order to determine the RSSI for a particular BSSID issue the following command:
C:\Users\Chris>netsh wlan show all >> rssi.txt
This will generate a text file with a ton of information including the network adapters Windows is managing, WLAN profiles and their settings, and per-BSSID information. Most important is the Signal value represented as a percentage.
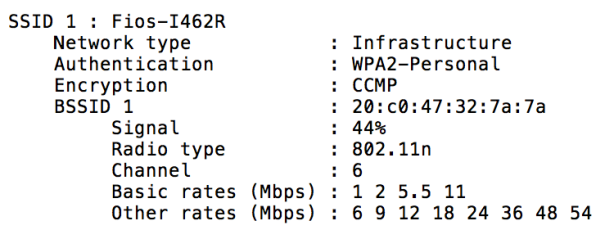
In order to translate the Signal percentage into an RSSI value, divide the number by two and subtract one hundred. So in the case of the WLAN above, a Signal percentage of 44% would translate to an RSSI value of -78 dBm. I would typically run this command 10-15 times (change the filename or it will overwrite the previous reading) and then import the Signal value to Excel for processing.
iOS
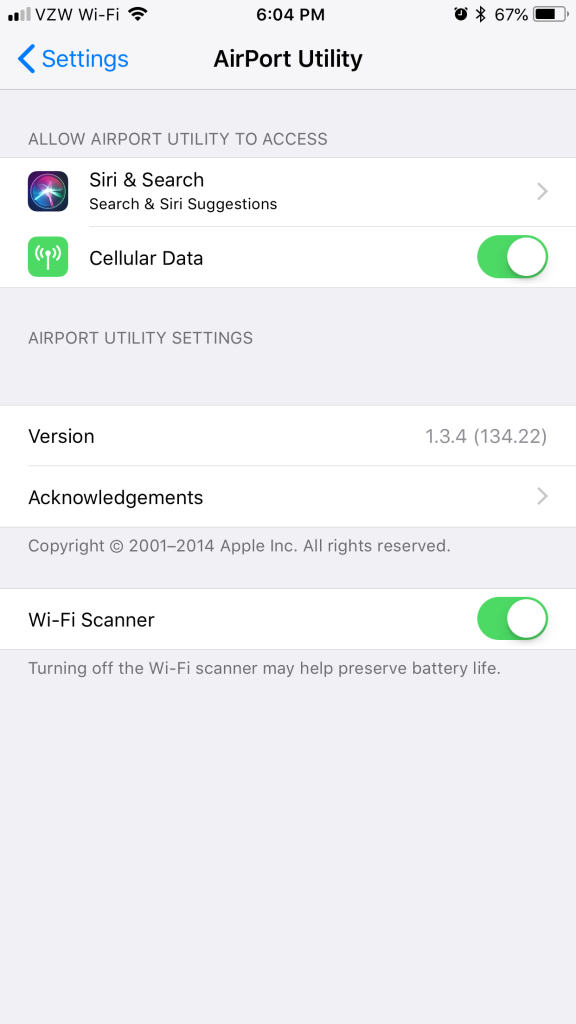
The following process is the same regardless of iPhone or iPad. Use the Airport Utility app to collect this information but first be sure to enable the Wi-Fi Scanner setting from within the iPhone settings.
![]()
Once the AirPort Utility is configured launch the app and click the scan button in the upper right-hand corner. You can filter the scan to narrow the real-time results.
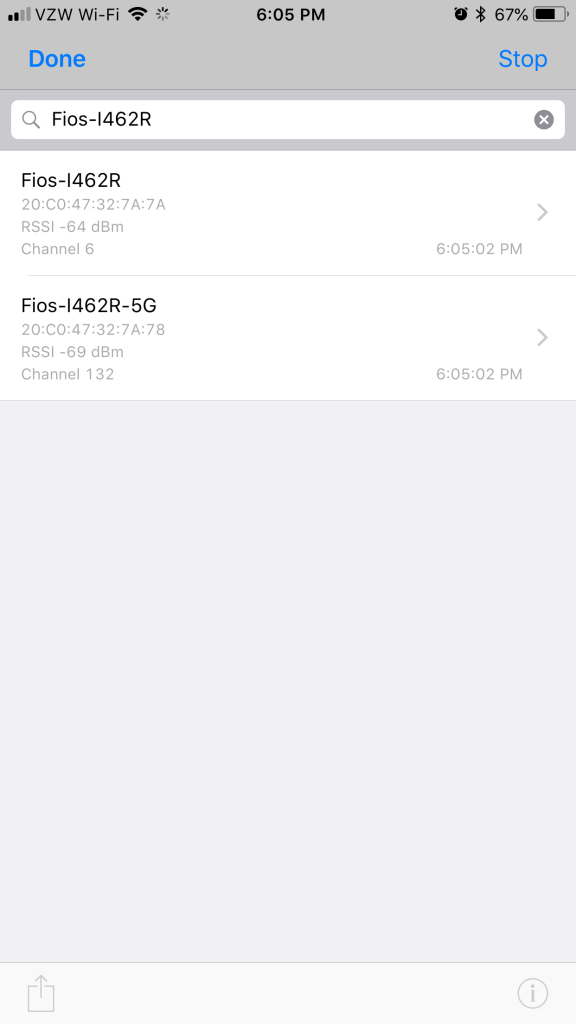
After letting the app scan for short period of time stop the scan and click the share button in the lower left-hand corner. This will allow you to send the results as a CSV file to a destination of your choice. Again, populating this data into Excel makes processing much easier.
Mac OS X
From the terminal prompt on a Mac I use the command (single line):
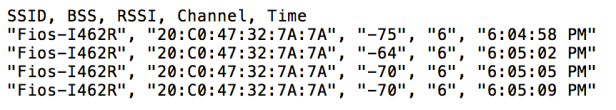
MacBook:~ Chris$ while x=1; do /System/Library/PrivateFrameworks/Apple80211.framework/Versions/Current/Resources/airport -I | grep CtlRSSI; sleep 1; done
I like this command because it generates output I can capture in a text file from Terminal that I can provide to a client if necessary rather than a screenshot from the native wireless utility or the Wi-Fi Signal app.
Selecting an Offset
I find this to be an interesting topic for discussion, especially in environments where the wireless network must support multiple device types, each with different receive sensitivities. I think there are two components to selecting an offset: determining an offset when the RF design must support a single device, and determining an offset when the RF design must support multiple devices.
For the first decision, do you select the lowest reading collected? Maybe the average? Or the most common reading? I tend to use the average of all readings taken, especially since the device is stationary when readings are collected. It’s not as if the device moved into a position or location where conditions deteriorated when a reading lower than the average was recorded.
For the second decision, do you chose the device with the lowest reading? Maybe the most common device based on number of units in the field? Or possibly mission critical devices? Maybe an average of the average reading from all devices? In a healthcare environment, clinical and voice/paging devices are mission critical but patient satisfaction scores (think iPhones and iPads) are also very important. It probably makes sense to select the weakest device to ensure no device has inadequate coverage however this may lead to a more dense deployment of APs than anticipated. In smaller deployments this may not be an issue but cost could become a factor in larger environments.
Ekahau Device Profile
Once you’ve selected an offset you can configure Ekahau to compensate the survey readings with a Device Profile. From the menu bar in Ekahau select Project > Device Profiles to create a device profile based on the client device you’re calibrating for. In the example below I’m using a 6 dB offset to compensate for the difference in receive sensitivity.
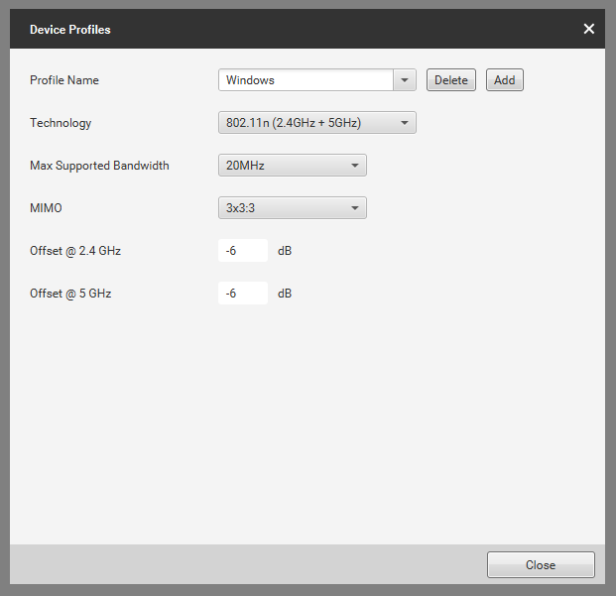
Once you’ve created the profile, use CTRL+left click (Windows) or option+left click (Mac) on the RSSI legend in the lower right-hand corner to select the device profile. This will
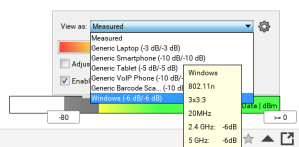
This will adjust the heat map rendered on the floor plan to illustrate coverage based on the wireless device receive sensitivity.
Hopefully this was informative, please leave a comment or start a discussion on Twitter if you have questions or suggestions!

Thanks for the informative write up. Lots of good details.
One thing that is missing is the ‘RANGE” of target devices. I’ve found a sometimes huge range in between like devices. Up to a 15dB to 20dB range within same type devices.
So you need to do these comparisons and captures on a fairly large statistical sample before making a conclusion about the compensation variable you will apply.
As in, it depends on WHICH Proxim card might be your baseline, compared to WHICH individual iPhone – both have wide ranges. If you picked the worst Proxim and the best iPhone the differential could be small, the opposite is also true with a resulting wide differential..
Keith
LikeLike
Thanks for the informative feedback Keith. It just goes to show how many variables go into a quality RF design.
LikeLike
Check out Blake Krone’s RSSI Compared website for more information and statistics on a variety of Wi-Fi NICs. http://RSSICompared.com
LikeLiked by 1 person
Nice article! I had never really considered that survey equipment may not have the same receive sensitivity and could possibly have pretty big impact on resulting data.
Well written and useful steps/screenshots.
LikeLiked by 1 person
Some great insights here Chris and certainly applicable to a well considered design methodology. The sensitivity of my SideKick compared to some old handheld scanners leaves a very wide margin for error. Attending the ECSE course a couple of years ago drummed into my mindset to make damn sure you measure using many different client types and the same for attenuation of materials. Garbage In Garbage Out…
LikeLiked by 1 person